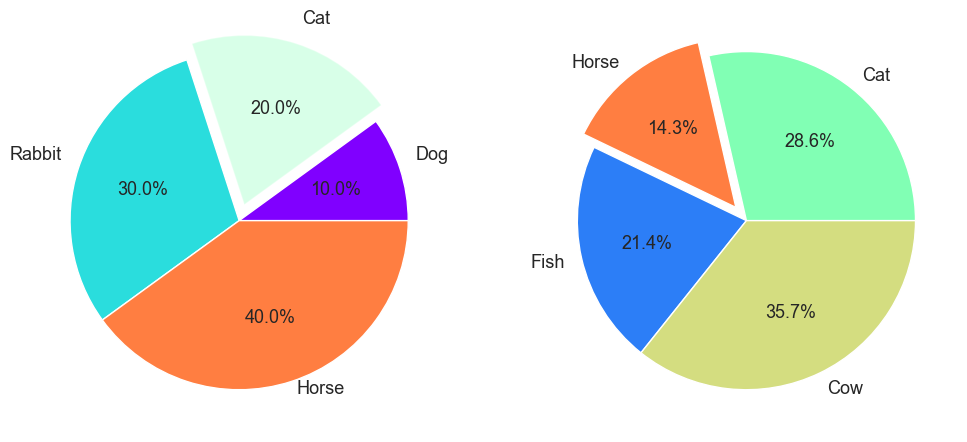
Today I came across a case for which I need put two figures side by side and I would like to use the same color to indicate the same element across the figures. After some searching on the internet, here is the solution I settled on.
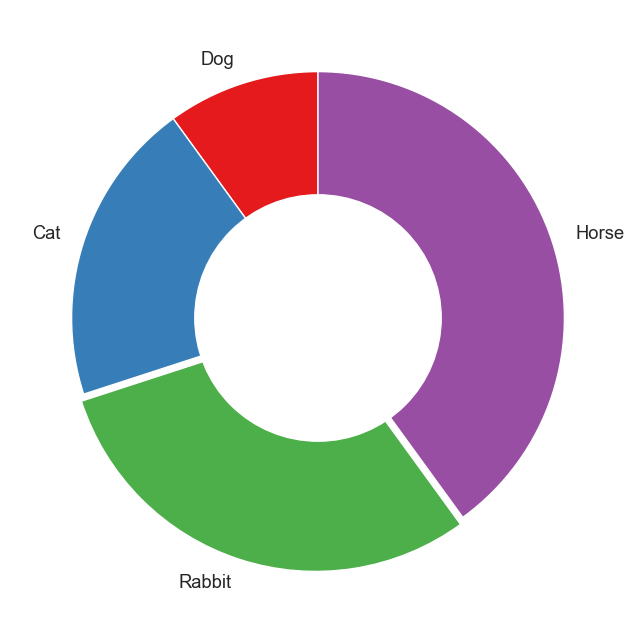
import pandas as pdimport matplotlib.pyplot as pltimport seaborn as snssns.set_theme()data_a = pd.Series(data=[1, 2, 3, 4], index=['Dog', 'Cat', 'Rabbit', 'Horse'])data_b = pd.Series(data=[4, 2, 3, 5], index=['Cat', 'Horse', 'Fish', 'Cow'])index_set =set()index_set.update(data_a.index)index_set.update(data_b.index)cm = plt.get_cmap('rainbow')colors = [cm(1.0* i /len(index_set)) for i inrange(len(index_set))]color_dict = {label: color for label, color inzip(index_set, colors)}fig, axes = plt.subplots(1, 2, figsize=(12, 6))patches, texts, autotexts = axes[0].pie(data_a, labels=data_a.index, colors=[color_dict[label] for label in data_a.index], explode=[0, 0.1, 0, 0], autopct='%.1f%%', textprops={'fontsize': 13} )patches[1].set_alpha(0.3)# patches[2].set_visible(False)for text in texts: text.set_verticalalignment('bottom')patches, texts, autotexts = axes[1].pie(data_b, labels=data_b.index, colors=[color_dict[label] for label in data_b.index], explode=[0, 0.1, 0, 0], autopct='%.1f%%', textprops={'fontsize': 13} )# hole = plt.Circle((0, 0), 0.65, facecolor='white')# plt.gcf().gca().add_artist(hole)